


The Big Green Picture #1: Clearing the Air
Introducing The Big Green Picture in the hazy backdrop of Mumbai in a COVID-19 lockdown: the city with the worst air pollution in the world, apparently.
I spent the past few days, obsessive like a two-bit Sherlock to learn about the world of air quality monitoring. Numbers, intuitive platforms, not very dry reading, there's a lot to like. This interest came from an alarming claim.
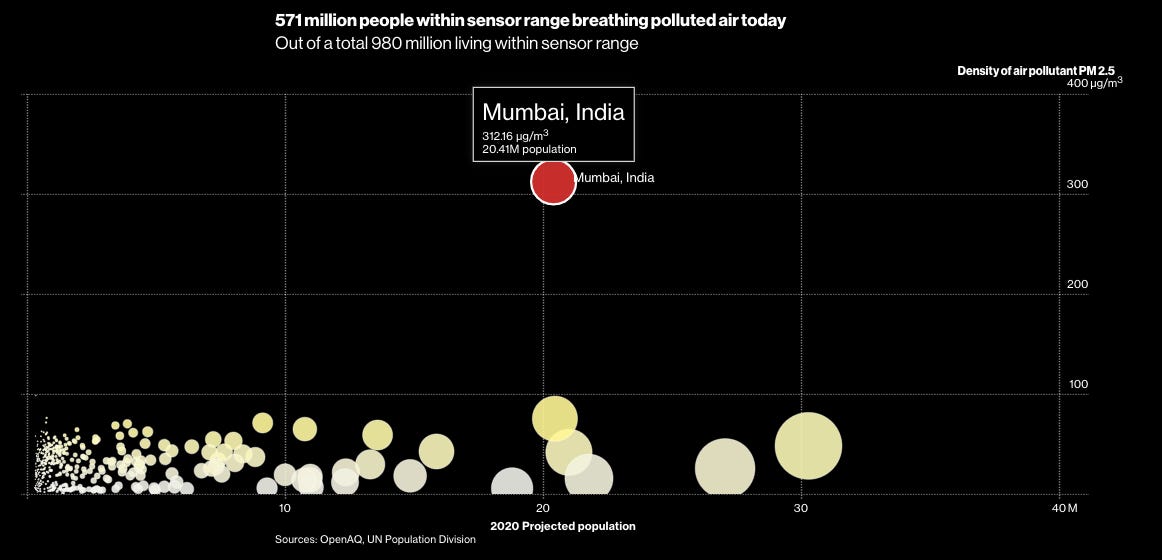
On 1st May 2020, Bloomberg Green reported that Mumbai in a COVID-19 pandemic in a lockdown across the city, had the highest level of air pollution in the world with a PM2.5 concentration of 312 μg/m3 (micrograms). PM2.5 is particulate matter (dust) less than 2.5 microns in size which you have no chance of avoiding unless you are perpetually masked. Which you likely will be for the foreseeable future, which is another story.
Mumbai is the same city where alarm bells rang on 3rd December 2019, when at peak activity, its 20 million people full of action led to unhealthy air pollution levels of 114μg/m3. On 1st May 2020 this coastal city, under the most comprehensive lockdown of industrial, construction, traffic activity it has ever experienced, was registering pollution levels exceeding anything it had previously faced.
This number is of course wrong. Mumbai was not the most polluted city in the world on 1st May 2020.
Here’s what happened.
Data ≠ cold hard facts
The issue lies in how institutional air quality sensors, run by the Central Pollution Control Board (CPCB), record real-time pollution data. Pollution data is recorded at 15 minute intervals. There are times where an error occurs and the actual pollution levels for a particular air pollutant cannot be measured at that time. When this happens, the real-time value for PM2.5 at that interval is marked with a filler value: 985 μg/m3. You can identify this error reading when you look at the pollution levels for the same time interval at a later period, where it is now historical data - no longer real-time. Here, the error figure of 985 μg/m3 would be discarded, and PM2.5 will not be recorded, a gap in the data.
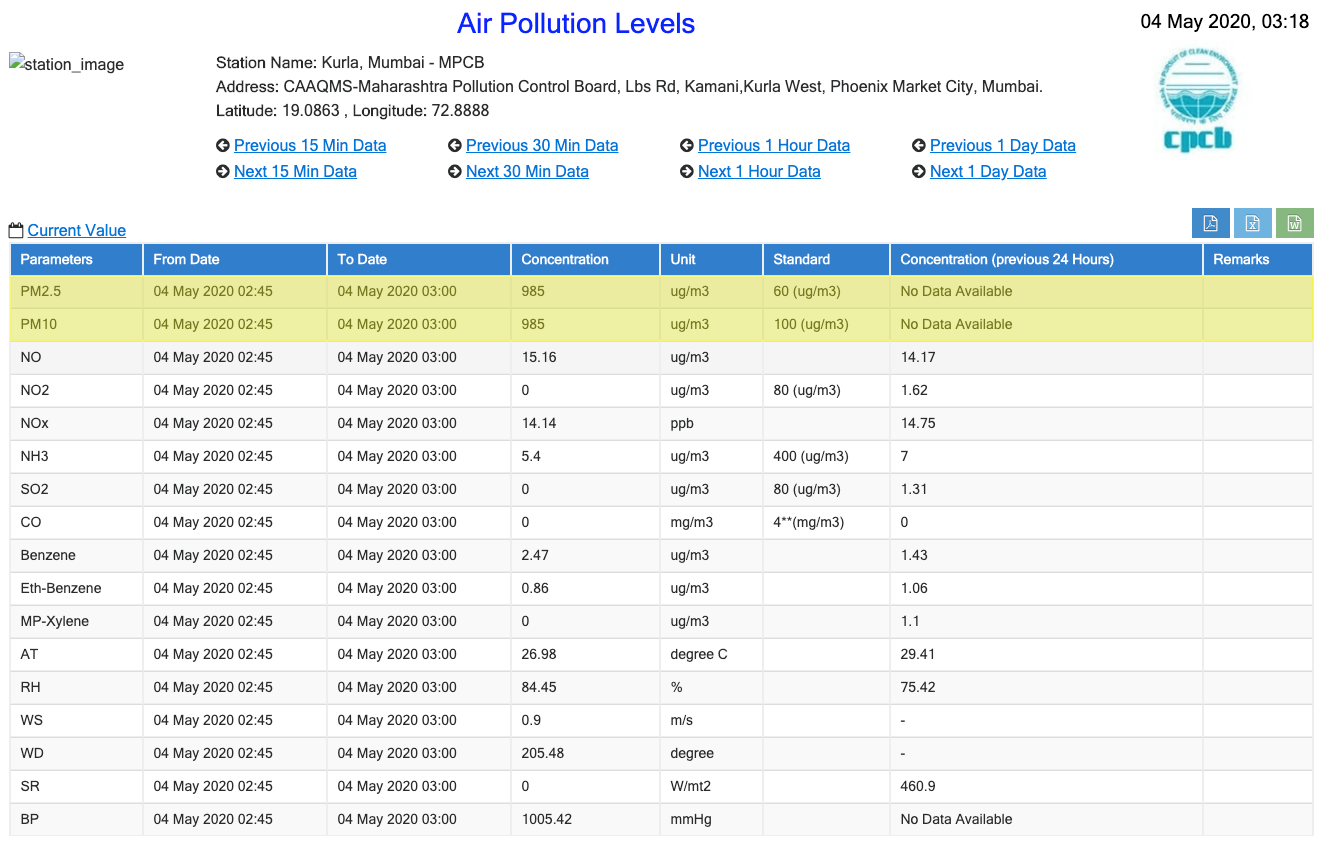

Screenshots from the CPCB monitoring station for Kurla, Mumbai for 2.45 am on 4th May. Above is the real-time pollution levels for this time period, showing both PM10 and PM2.5 concentrations at 985 μg/m3 (highlighted in yellow). The bottom image is the pollution levels for 2.45 am in Kurla as a historical record, where PM2.5 and PM10 are not recorded.
985 μg/m3 - the equivalent of smoking 44 cigarettes in a day - is an interesting number. This standard filler for marking errors in concentration extends beyond India, found in sensors in the US as well. 985 μg/m3’s use as a filler, unfortunately, seems to presage rampant levels of air pollution from growth, industrialisation, and shifting crop growing patterns to improve water tables that we have been experiencing recently.
There have been reports of 985 μg/m3 as actual PM2.5 levels in Delhi in 2013, Delhi in 2015, Delhi in 2016, Muzaffarpur in 2017, Doranda, Jharkhand in 2017, Delhi in 2017,Vizag in 2018. When you check these occurrences with the historical records at the specified time instance, 985 μg/m3 wasn’t a filler value for an error. It was the true figures of the air quality at these places and times.
In the case of Mumbai on 1st May 2020 however, they were filler numbers as PM2.5 levels could not be measured by 2 air quality monitoring sensors in Mumbai.
Bloomberg Green gets its data through OpenAQ, an open data platform for real-time air quality monitoring that is somewhat global - it covers large swathes of land but misses out on a fairly wide area. It does not measure air quality directly. It relies on raw data from institutional centres - government or international organizations, which for Mumbai and India, is CPCB monitoring stations and one sensor in the American Embassy.
Bloomberg Green draws from OpenAQ's real-time data for PM2.5 from all active sensors within a 10km radius of the centre of any urban area over the 24 hours period preceding an update. For Mumbai, this centre is a traffic intersection in Kurla.
An update took place on the morning of 1st May 2020 at 9.00 am EST (7.30 pm IST). From 9.00am EST on 30th April, the recordings of 12,000 sensors tracked in OpenAQ across the world were logged for PM2.5 concentrations, including 5/6 active sensors in Mumbai. 2 of those sensors - in Kurla and at the nearby non-functioning Chhatrapatti Shivaji International Airport - were recording real-time PM2.5 levels at 985 μg/m3 for the entire 24 hour period. OpenAQ's reliance on real-time data led to it recording the default error filler of 985 μg/m3 as a factual number, which it was not.
Parsing that with the concentrations recorded in the other properly functioning sensors led to the declaration that Mumbai, a city under lockdown and quarantine in the face of a global pandemic, was the most polluted city in the world.
If you took the average of the other sensors, the true PM2.5 levels in Mumbai on 1st May 2020 would be around 20-50 μg/m3.
Why this matters
This is more than a cosmetic error. We all need to make better decisions for sustainable development. Instances like this do not help as they inform readers’ perception.
Bloomberg Green and OpenAQ reported data incorrectly. This is a common fault of platforms that over-rely on cold hard data, without accounting for the context in which these numbers occur.
This was not flagged to either Bloomberg or OpenAQ until a tweet I sent on 11th May. Which means anyone who read this on Bloomberg either did not care that Mumbai in a COVID-19 lockdown had the worst air quality in the world, or that they accepted it at face value - associating the wrong Indian city as the poster child for air pollution. Or the most likely third option. People saw it, shrugged, and moved on, which means Bloomberg’s got to do more in engaging people and most people have a better idea of a pass time than I do.
This all calls into question how people view information on sustainability broadly, not just air pollution. How accessible is such information? How much understanding is there? How much do they take at face value? How much do they poke into it? What do they poke into? What makes them poke into something? What expectations do people have on the subject? What do they know? What would they want to know?
Sustainability is still secondary
Sustainability is still often treated as a barely tolerable vase which is rolled out when the friends who gifted it to you come visiting, or used like a Potemkin village.
Some things have improved in sustainability over the past 10 years. There is more recognition of the problem. We got a global agreement in 2015 on climate change between all governments, even North Korea, which slammed the US when they decided to pull out in 2017. The lack of sufficient follow-on action is another thing entirely.
Changes may not have kept pace with need, but they have started to set in, and even been transformative in cases like electric vehicles. (Yes, it is a small proportion in the auto space but look at the wider industry shift. Yes yes, there are adverse impacts on how resources are sourced, but the benefits from a value chain perspective are overwhelming. Besides the growth in urban mining of recycled e-waste can help to reduce traditional mining. Also metal trees.)
But, conversations, perceptions have not budged much. As have the decisions based on them.
Decisions, decisions, decisions
Better decision making is about being better informed. We need impact-driven narratives that dig in more, and present facts with context to better inform on sustainable development.
There are great practitioner-based conversations through blogs, thought pieces, and columns - practical advice, industry viewpoints, a lot gets covered here. There are fantastic media approaches driving the reportage and narrative mainstream - Quartz, The Guardian, and (air quality cock-up aside) Bloomberg Green are doing some very good stuff.
But there are many working parts of what is sustainability. Things done by individuals, organizations, governments. There are many influences and externalities that have knock-on effects on how we can act towards sustainability. There are diverse threads to unravel that link-up. There are things that went wrong and their fixes, and things that went right and their lessons. There’s a lot to unpack.
That is what I will look to cover through The Big Green Picture. It will span a wide area: environment impacts, finance’s role, socio-economic interactions, new patterns and trends, biodiversity initiatives with some wider impact, policy decisions positive and negative (I am mainly expecting the latter), real-life cases of approaches gone good and bad, models and tools organizations are using, and more; all to better understand shifts for sustainable development - a reality which is going to take a lot more than just a newsletter.
If you (especially you blessed few who I have bombarded for feedback to get this going) find this interesting, or curious, or know anyone who might, there’s a Big Green Button above for you to get a lot more where I hope not to disappoint.
If I do disappoint, you know where to find me.
Fascinating, Shravan! You should share at least some of these pieces with the NELIS comms team, led by Lucas, who are now activating the NELIS medium account. Cheers!